Tools
G-Log
Web server log analysis for admins
1.1.4
2.9 MB
Overview
1.7 s
from a 10 GB log to a full report
42,600,000
lines read, all questions at the same time
11
chapters, from traffic to security, and the advice
2.9 MB
one executable, no runtime, no install needed
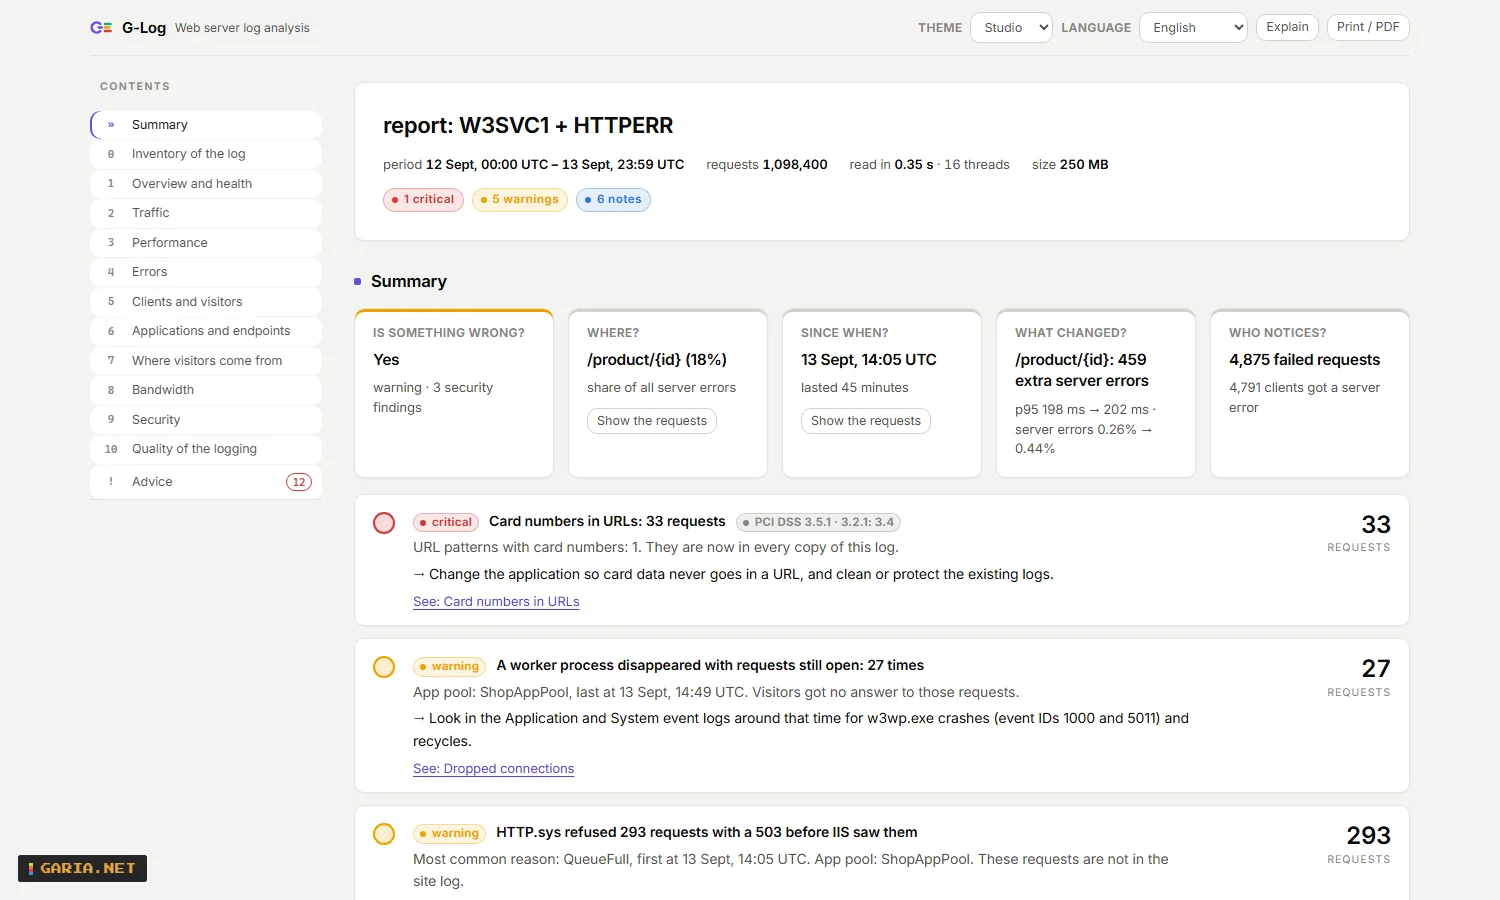
G-Log turns web server logs into an answer. Point it at a folder, a share or an SSH path: it reads the logs once and hands back one self-contained page – is something wrong, where, since when, what changed and who notices. IIS and HTTP.sys, ASP.NET Core, Apache and nginx, packed or not.
Standalone on one server, or an agent on each with a G-Log server in front. Every function is also a command, a REST call and an MCP tool, and NinjaOne fills its custom fields for one machine or for all of them. Version 1.1.4, 2026-09-21.
| Report | One HTML page that stands on its own, laid out like an application: a sidebar that marks the chapter you are reading, every finding with its figure beside it, and the explanations switched off in one click once you know your way around. In English, Dutch, French, Spanish and Portuguese. The same report as JSON for a script, as CSV for a spreadsheet, or as a plain-English summary for an alert. |
| Command line | glog.com --report C:\inetpub\logs\LogFiles\W3SVC1 --out report.html. Exit code 3 when there is a finding of the severity you choose, so a scheduled task or an RMM can act on it. |
| Search | glog.com --search <folder> "status:5xx url:/api/* from:07:00 to:07:20" gives the requests themselves, with file and line number, as text, JSON or CSV. |
| AI assistant | glog --mcp is a Model Context Protocol server over standard input and output, and a server offers the same tools over HTTP: an assistant asks the same questions and gets the same numbers as the page. |
| A cluster | An agent on each web server summarises its own logs; a server collects those and shows every site in one page, with alerts, search and reports on a schedule. The log lines stay where they are. |
| Deployment | An MSI with real properties for SCCM, Intune, GPO and NinjaOne, ready-made NinjaOne scripts, and a NinjaOne connection that fills the custom fields of every web server by itself. |
Reads IIS, ASP.NET Core, Apache and nginx, packed or not
u_ex*.log w3clog*.txt access.log access.log.1 *.gz *.zip httperr*.log \\SERVER\logs$ ssh://user@web03/var/log/nginx
The usual shapes are recognised by themselves, including nginx logs written as JSON. Wrote your own log_format or LogFormat? Hand G-Log that line, or the configuration file it stands in, with --log-format.
What you get
| Five questions | Is something wrong, where, since when, what changed and who notices – each with the answer measured from the log. |
| Advice | 36 kinds of finding, most severe first, with the numbers, what it means and what to do. Card numbers in URLs carry their PCI DSS requirement. |
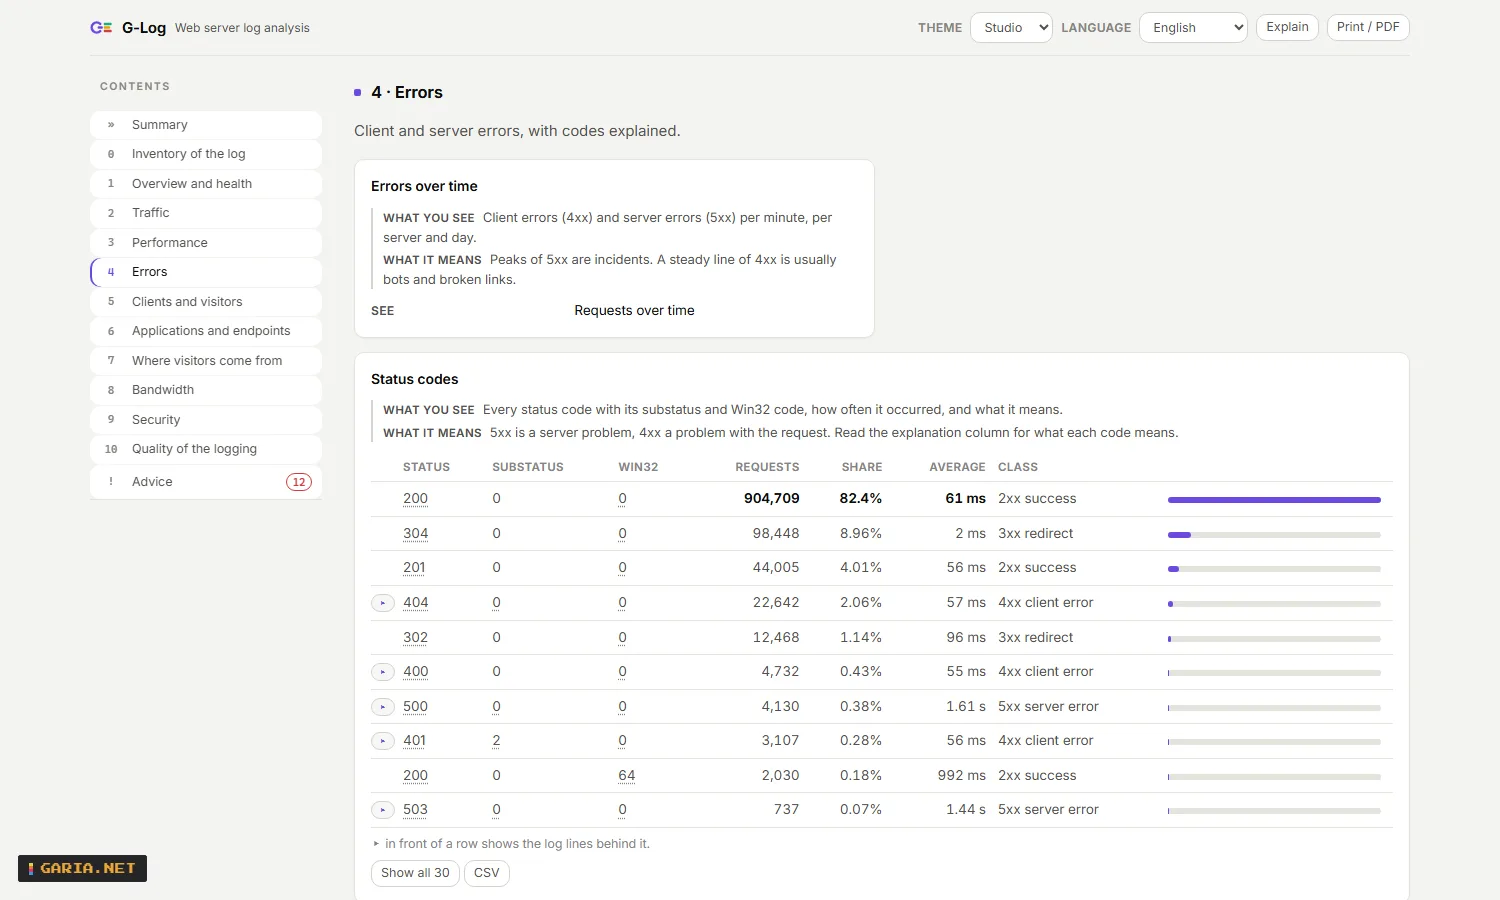
| The log lines | Next to a row with errors, a slow page or a security finding, one click opens the lines from the log itself: file, line number, and every field by name. |
| Two periods | --compare with yesterday or the week before a deploy: what got slower, which errors and endpoints are new. |
| Honest gaps | An analysis that the log cannot support says why, and chapter 0 says which field to turn on and how – instead of showing an empty table. |
| Export | JSON, CSV per table (also from the page), and a plain-English summary. Every number in the page comes from the same report. |
G-Log only reads. It opens log files so the web server can keep writing, rotating and deleting them while it reads, and it changes no setting on your web server – not the logging fields, not the rollover, not the ETW destination. Reading a log installs nothing and opens no port; a service and a port come in only when you choose to run the agent or the server for a cluster, and then you say so yourself.
Screenshots
Examples
The report of a site, in the browser
glog.exe --open C:\inetpub\logs\LogFiles\W3SVC1Or right-click a log folder, a .log, a .gz or a .zip and choose Analyse with G-Log.
A site together with the HTTP.sys error log, and yesterday next to it
glog.com --report C:\inetpub\logs\LogFiles\W3SVC1 --report C:\Windows\System32\LogFiles\HTTPERR ^
         --compare C:\inetpub\logs\LogFiles\W3SVC1\u_ex260912.log --out today.html
The requests behind an incident
glog.com --search C:\inetpub\logs\LogFiles\W3SVC1 "status:5xx from:2026-09-11T10:00 to:2026-09-11T10:29"
glog.com --search C:\inetpub\logs\LogFiles\W3SVC1 "client:10.51.141.11" --format csv --out client.csv
In a script or an RMM: the last 15 minutes, as an alert text
$glog = "$env:ProgramFiles\GariaNetTools\G-Log\glog.com"
& $glog --report C:\inetpub\logs\LogFiles --since 15m --format text --fail-on warning
if ($LASTEXITCODE -eq 3) { exit 1 }
Use glog.com, not glog.exe: it waits for the analysis and passes the exit code on. Only the lines of that window are read, and log files last written before it are skipped, so a folder with months of logs costs no more than today’s file.
One table for a spreadsheet or a ticket
glog.com --report C:\inetpub\logs\LogFiles\W3SVC1 --tables
glog.com --report C:\inetpub\logs\LogFiles\W3SVC1 --format csv --table errors.statusCodes --out status.csv
Install (MSI)
One MSI, per machine, 64-bit, nothing else needed: the report page is a resource inside glog.exe and the runtime is compiled in. It goes out through GPO, Intune, SCCM or an RMM without a wrapper script.
msiexec /i G-Log-1.1.4-x64.msi /qn
msiexec /x G-Log-1.1.4-x64.msi /qn
ADDTOPATH | 1 (default) or 0 – the installation folder in the system PATH, so glog works in every new command prompt |
CONTEXTMENU | 1 (default) or 0 – Analyse with G-Log on folders and .log, .gz and .zip files |
MASKSENSITIVE | 0 (default) or 1 – client addresses, user names, passwords, tokens and card numbers masked in every report |
INSTALLFOLDER | another folder, default C:\Program Files\GariaNetTools\G-Log |
msiexec /i G-Log-1.1.4-x64.msi /qn ADDTOPATH=1 CONTEXTMENU=0 MASKSENSITIVE=1 INSTALLFOLDER="D:\Tools\G-Log"
G-Log-1.1.4-setup.exe /VERYSILENT
An update never needs a restart. Whatever is running from the installation folder steps aside first – the services, and an agent or server that is not a service: a scheduled task, an RMM, a window someone left open. They carry a hidden window so Windows can ask them to close the way it asks any other program, and the installer starts again what it stopped. An agent that ran under its own account is not put back, because its credentials are not kept anywhere; that is written to the registry under LastUpdate so you can see why it is standing still.
G-Log never checks for updates by itself. Ask it and it answers: glog --check-update gives exit code 0 up to date, 3 when there is a newer version, and 1 when garia.net could not be reached – so an RMM can put a condition on it. Nothing about the machine goes with that question.
Start the MSI from a local folder such as C:\Temp. On many work computers Downloads lives on a network share or in OneDrive, where the Windows Installer service cannot read it: that ends in error 1619 without installing anything. Read access to the log folders is all G-Log needs; it does not have to be an administrator.
Rolling out the agent and the server, the rights they need, which fields to log in IIS, and what to do about a log folder on a share: the administrator guide walks through it. It is installed as well, under docs.
Agent and server
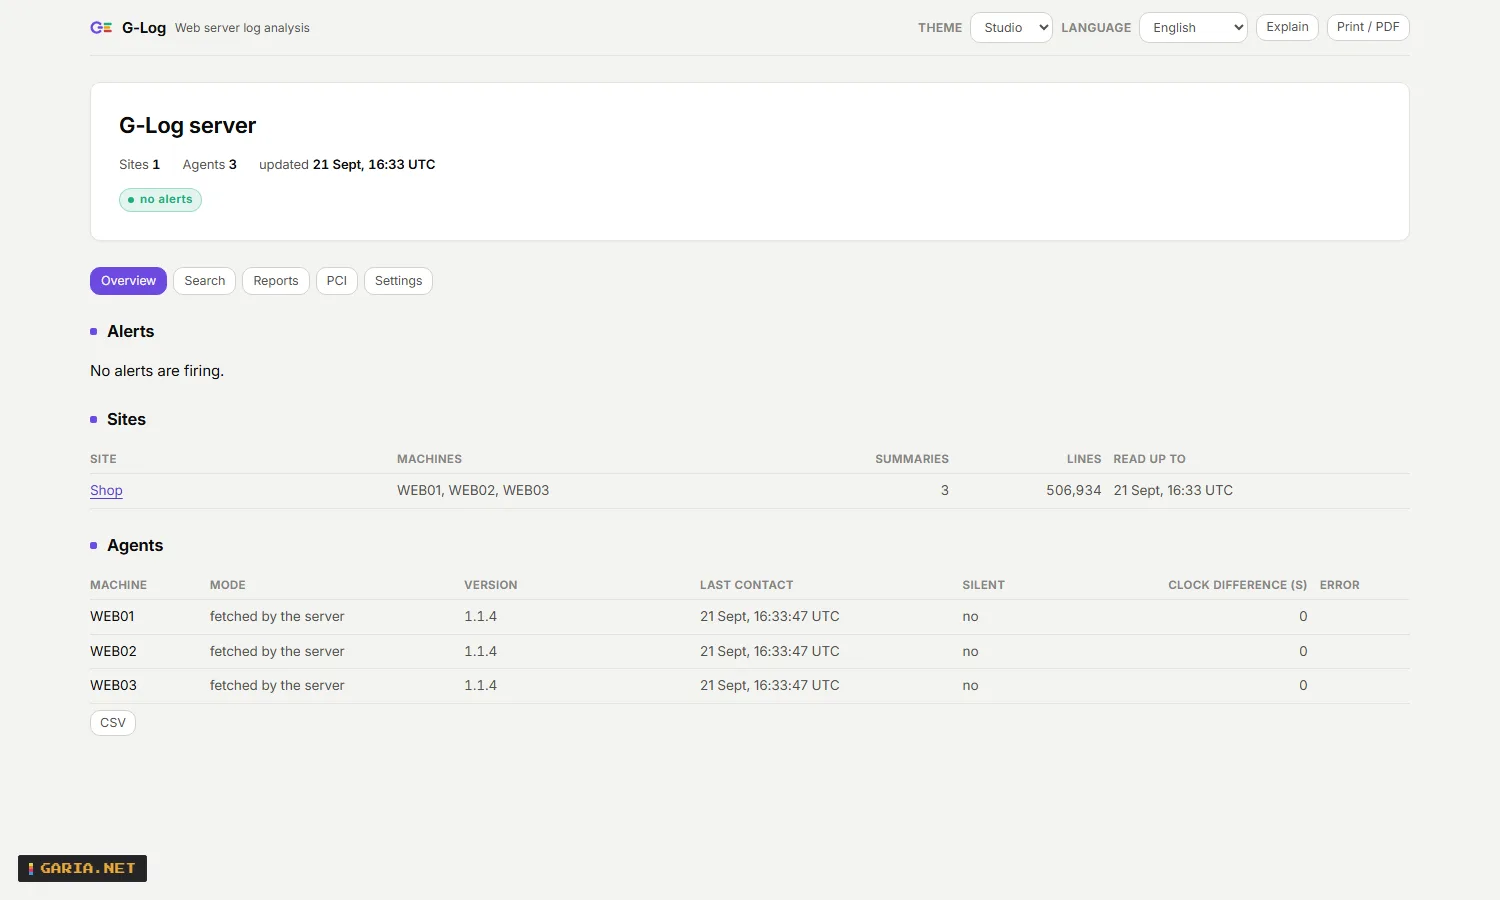
One log file is a command away. A cluster is something else: five web servers, three sites each, and the question is which one started failing. G-Log answers that without moving your logs anywhere.
| The agent | Runs on the web server, reads its own logs and sends a summary – a few hundred kilobytes a day instead of gigabytes. The log lines never leave the machine; when the server needs them, it asks for exactly the ones you searched for. |
| The server | Collects those summaries and makes one report per site over every machine. Sites are matched by their name in applicationHost.config, not by W3SVC7, because that number differs per node. |
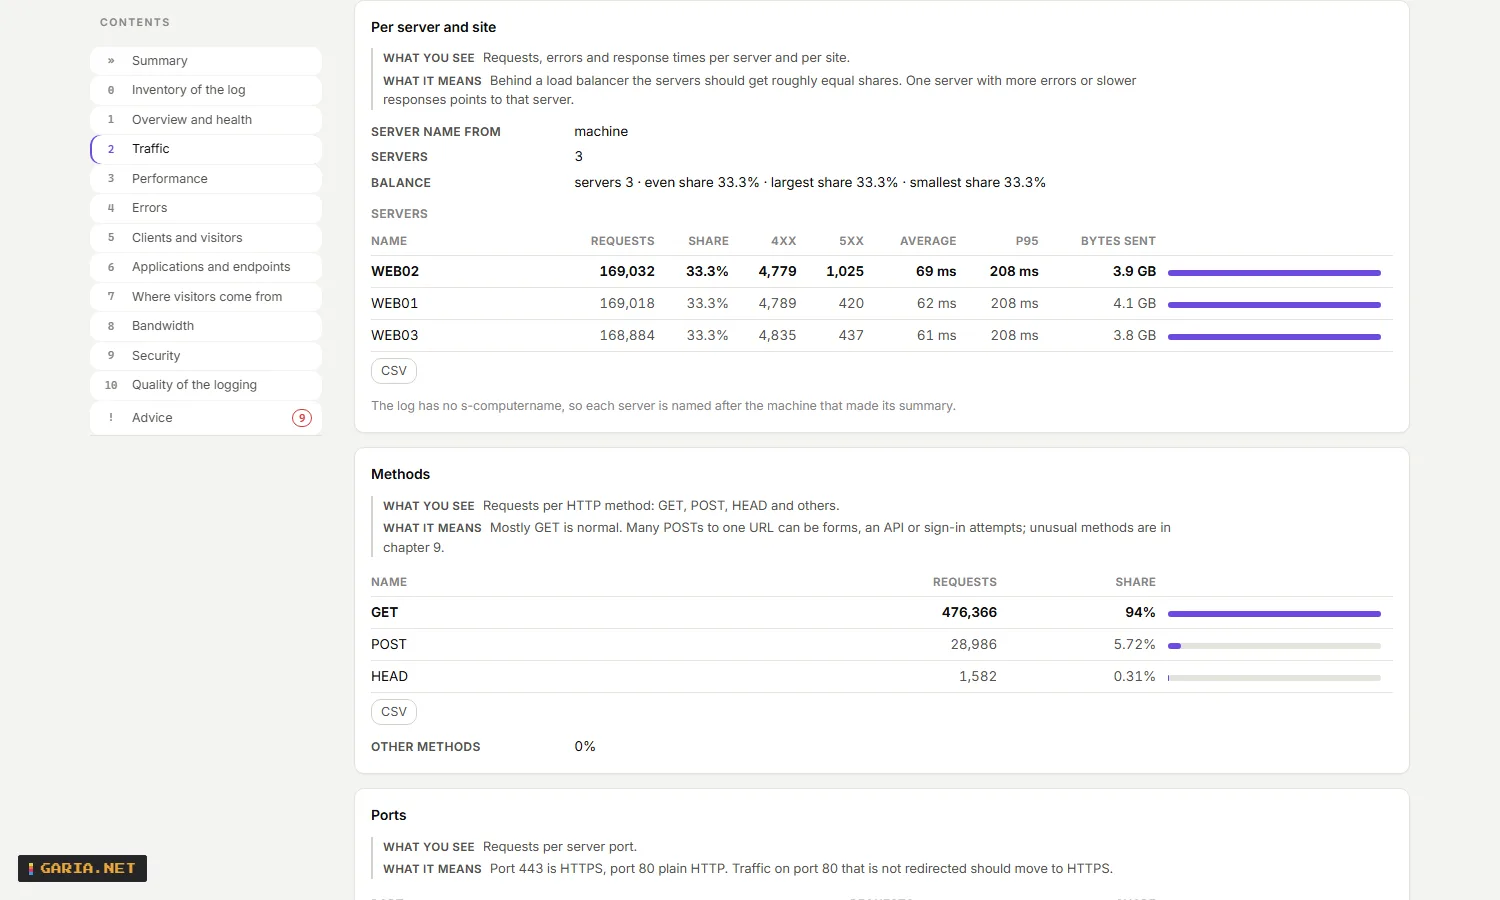
| Without an agent everywhere | One agent on a jump server can read the log folders of several web servers over their admin share: --agent-path "Shop=\\web01\d$\inetpub\logs\logfiles\W3SVC1". The name in front of the path names the site, so the same site under a different IIS id on each server still becomes one report, with the servers side by side in Per server and site. |
| One page | Alerts, sites and agents on the front screen, and behind its tabs: search the log lines of a site, the reports that were made on schedule, the PCI review, and the settings of that machine. |
| Encrypted | Agent and server speak TLS and recognise each other by the fingerprint of their certificate. Pairing is one command and a one-time key, so the key that opens the whole cluster is never typed on a web server. |
| Linux too | A web server without an agent – nginx or Apache on Linux – is read over SSH, and only the bytes that were added since last time come across. Signing in goes with a key, or with a password when that server takes nothing else: --ssh-password asks for one, --ssh-save-password keeps it with the other keys so a service can use it. |
A server and an agent, in two commands
glog --server --pair-key                     on the collecting server: prints a one-time key
glog --agent --pair <key> --push https://logserver:7788
Both run as a Windows service with --service. The agent reads with one core in background priority and a hard ceiling of ten percent of the processor: the web server comes first.
| Alerts | A site that fails, one that is slower than its own baseline, a server that has gone quiet, logging that stopped. Out through the Windows event log, a webhook, or syslog and CEF to your SIEM – every alert carries a link to exactly the view it is about. |
| Server context | App pool crashes and recycles, deploys, certificates with their expiry date, and what the worker processes were doing – next to the requests, on the same timeline. |
| Reports on a schedule | A daily report at six, a weekly one on Monday, written to a folder or a share, with a retention. Plain JSON to configure, no scheduled task. |
| To your SIEM | An agent can forward the log lines themselves over syslog, raw or as CEF, filtered with the same query language as the search. G-Log delivers to a SIEM; it does not replace one. |
| Within seconds | HTTP.sys writes its buffer once a minute. With --etw an agent reads along over the IIS ETW provider instead, on IIS 8.5 and later. G-Log never changes that IIS setting for you. |
Service account
The services do not have to be LocalSystem
By default GLogServer and GLogAgent run as LocalSystem: it always works, and it can read every file. G-Log only reads, so an account with read access to the log folders is enough – and on a web server that is usually what you want. Choose one with a thing in mind: what an account cannot read is missing from the report, and G-Log says so in chapter 0 rather than leaving it out quietly.
msiexec /i G-Log-1.1.4-x64.msi /qn AGENT=1 SERVICEACCOUNT="DOMAIN\svc-glog" SERVICEPASSWORD="..."The installer first grants that account the right to log on as a service and then creates the service under it. That order matters: sc.exe does not grant the right, and without it the service fails to start with error 1069 – a message that does not say what is wrong. SERVICEPASSWORD is a hidden property, so it does not end up in the installation log.
On an installation that already exists
glog --grant-service-logon "DOMAIN\svc-glog"
sc config GLogAgent obj= "DOMAIN\svc-glog" password= "..."
sc start GLogAgent
A virtual account (NT SERVICE\GLogAgent) needs no password and no right: the service manager arranges both. A gMSA needs the right but no password.
What that account needs, and nothing more
| The log folders | read access. On IIS that is the folder glog --sites shows; on a Linux web server over SSH it is the group adm |
%ProgramData%\GariaNet\G-Log | full access: the keys, the store and the audit trail live there |
| The Windows event log | only if you keep alerts there, which is the default |
applicationHost.config | read access, to find the sites by their name instead of by W3SVC7 |
It does not have to be an administrator and it does not need to log on interactively. LocalSystem is not a superset of you: it reaches other machines as the computer account, so a share you can open yourself may be refused, and its SSH keys live somewhere else. If an agent suddenly reads nothing after a change of account, that is where to look first.
The firewall
An agent and a server listen on the network, so Windows Firewall wants to know about them. The installers add a rule for the private profile when you choose the service (SERVER=1 or AGENT=1), and then nothing is asked. Start one by hand and Windows asks once, with Public networks already ticked – untick that and leave Private on. Only need it on this machine, or on one network card? --bind 127.0.0.1 or --bind 10.0.0.5 keeps it there, and then the question does not come at all.
PCI DSS 10
Requirement 10 of PCI DSS 4.0.1 asks for things a web server log can help with, and for things it cannot. G-Log does the first and says the second out loud.
| 10.4.1 | A review of every day that has passed, written by the server itself: the findings of that day, a status per finding (open, investigated, accepted, resolved) with its history, and a sign-off by name. Nothing is ever overwritten. |
| 10.3.4 | Every log file that is finished gets a SHA-256 the first time it is seen closed. A file that changes afterwards, or disappears, becomes a finding and stays one. |
| 10.2.1.3 | An audit trail of its own: who asked this server for which report, search, export or setting, from which address and with which key. |
| 10.3.3 | Forwarding the log lines to the central, protected place you already have, over syslog or CEF. |
| 10.5.1 | How far the history reaches, against the three months that must be immediately available and the twelve that must be kept. |
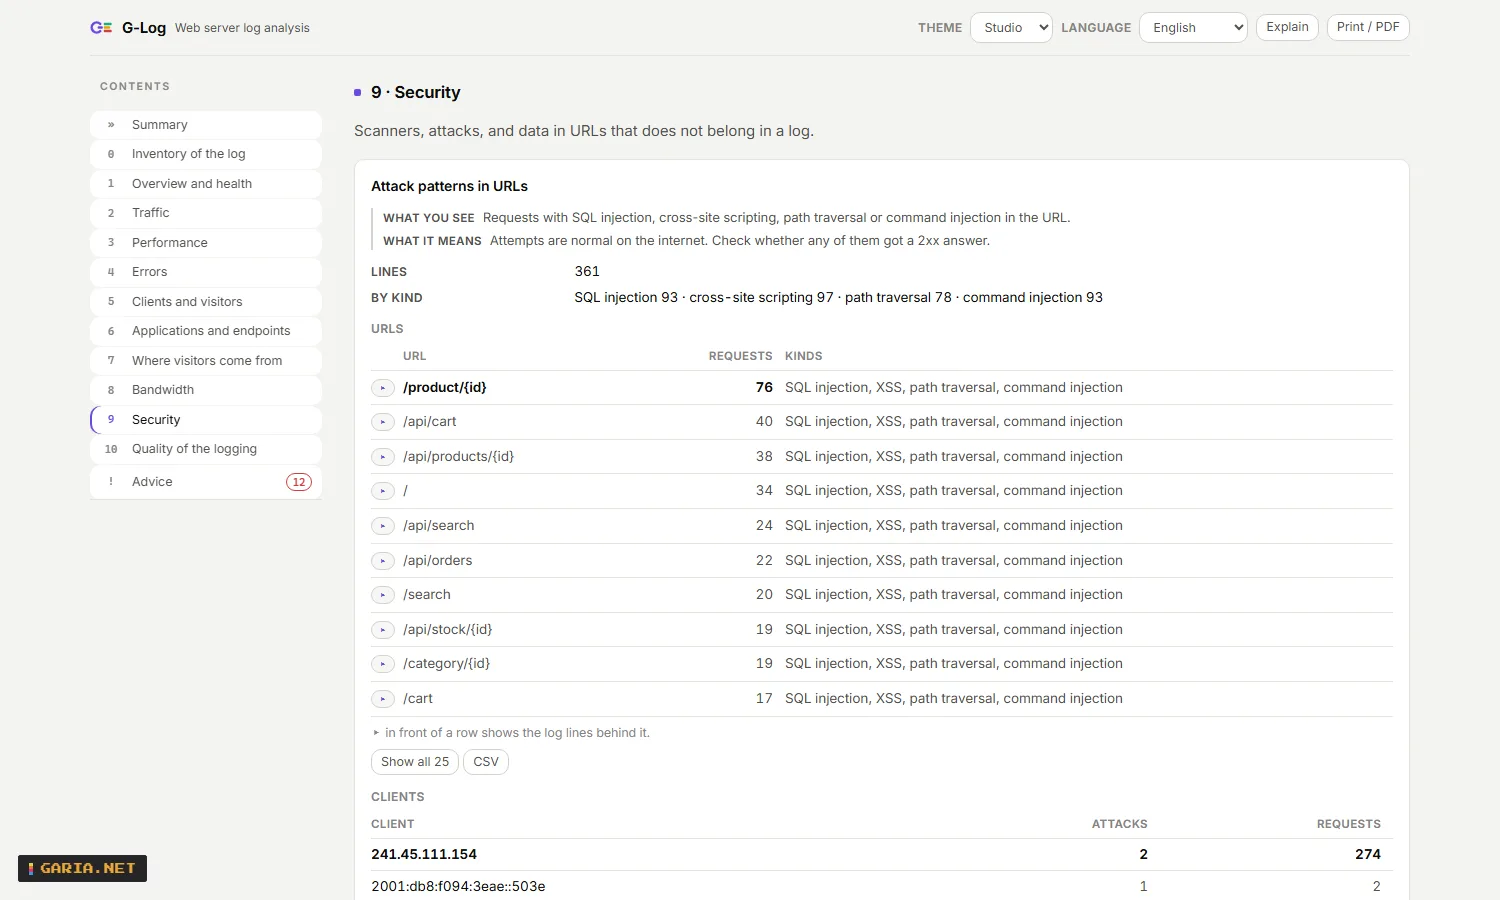
| 3.5.1 | Card numbers in URLs are found by their check digit and carry the requirement they belong to. Masking is a choice at install time, not a default. |
What a web server log does not hold: sign-ins to your application, administrator actions, and access to card data per user. Those come from the application and the Windows security log. G-Log is not the central log store an auditor expects either – it forwards to the one you have. It helps an organisation meet requirement 10; it does not make it compliant, and it says so on the page where you sign a day off.
A name is not an account. G-Log has no user accounts – whoever can read the logs can read the data – so what is recorded is the name someone typed and the Windows account the command ran under.
NinjaOne
NinjaOne has no web server log monitoring of its own: its HTTP monitor says from the outside that a site is down. These three scripts say why, from the logs on the server itself. PowerShell 5.1, run as System, every setting a parameter or a script variable.
| GLog-Alert.ps1 | Reads the last 15 minutes. Exit code 1 when there are findings of the chosen severity, and the output is the alert text: requests, error shares, response time, and each finding with what to do. |
| GLog-Report.ps1 | Reads the last 24 hours into custom fields: a summary, requests, server error percentage, p95, the findings, and an HTML report for a WYSIWYG field. |
| GLog-Search.ps1 | The log lines of the last hour that match a query, such as every server error on the payment pages, with an alert when there are any. |
| NinjaOne guide | Which custom fields to create, how to add the scripts, and what the output looks like. |
The scripts were tested under Windows PowerShell 5.1 with a stand-in for NinjaOne’s field command, against generated logs. They have not been run inside NinjaOne itself, and that is said here rather than left out. The same approach works from any RMM, a scheduled task or a runbook.
Or no script at all
A G-Log server can fill the same custom fields over the NinjaOne API, for every web server it collects, so nothing has to run on those machines. It needs an API app of the type Machine to Machine; the client secret is kept with the other keys, in a file only SYSTEM and administrators can read.
glog --ninja-setup --ninja-url https://eu.ninjarmm.com --ninja-client-id <id> --ninja-client-secret <secret>
glog --ninja-fields     shows what would be sent, without sending it
glog --ninja-now        sends it once
Alerting stays a condition in NinjaOne, on one of those fields or on the Windows event G-Log writes. That is not a shortcut: the NinjaOne API cannot raise an alert, and cannot open a ticket without a user context.
JSON, CSV and MCP
Everything the page shows is in one JSON report with a version, the same for the command line and for an AI assistant. The report schema lists every chapter, analysis, reason and advice code.
--format json | the whole report; --with-text adds the English title and what to do to every finding |
--format csv --table <name> | one table for a spreadsheet; --tables lists them. A value that a spreadsheet would read as a formula is made harmless |
--format text | a summary in plain English, for an alert or a ticket |
--fail-on info|warning|critical | exit code 3 when the report has a finding of that severity or worse |
--since 15m, --from, --to | only the lines of that window, in UTC |
An AI assistant on your logs
claude mcp add glog -- "C:\Program Files\GariaNetTools\G-Log\glog.exe" --mcpNine tools over standard input and output: an overview, the findings, ranked lists, a metric over time, what the log contains, what changed between two periods, the log lines themselves, a whole chapter, and what a status or error code means. The server only reads; writing an HTML report needs --allow-write, and then only to a file that does not exist yet. The answers are the same numbers as the page, because they come from the same report.
A G-Log server offers the same tools over HTTP at /mcp, behind its key, so an assistant on a workstation can ask about the whole cluster by site name instead of by path – with nothing installed on that workstation.
API
Everything the page does, from a script
Plain HTTP with JSON, no SDK. Every view in the page is one call, and the numbers are the same ones the report holds – there is no second source. The Postman collection has an example for every call; it also ships in the installation folder under api, next to the report schema.
On this machine the page listens on 127.0.0.1:7668 and asks for no key. A server or an agent on the network listens on 7788 over HTTPS with its own certificate, and every call needs the key of that machine in X-GLog-Token. Start with /api/hello: it says which role you reached, whether a key is required, and the fingerprint of that certificate. Call it over http:// by mistake and you get a 400 that says so, rather than a closed connection.
The report and the requests
GET /api/hello | tool, version, role, whether a key is needed, TLS fingerprint. The only call that never needs a key |
GET /api/report | the whole report as JSON, from path=, paths= or – on a server – site=, with since, from, to and compare |
GET /api/advice | only the findings, most severe first, with the numbers behind them |
GET /api/overview | the five questions and the key numbers |
GET /api/inventory | chapter 0: which files, which fields are logged and which are missing, and what that costs you |
GET /api/search | the matching log lines with file, line number and every field by name; pages with skip and limit |
GET /api/summary | the analysis in G-Log’s compact format – what an agent sends instead of the lines themselves |
GET /api/explain | what a status, substatus, Win32 code or HTTP.sys reason means, and what to check |
The cluster
GET /api/cluster/sites | the sites this server collects, with the machines that run them |
GET /api/agents | per agent: version, mode, last contact, clock difference, last error |
GET /api/alerts | what is firing and what resolved, each with a link to the view it is about |
GET /api/agent/status | on an agent: its sites, its last round, and what it forwarded or received over ETW |
GET /api/agent/summariesGET /api/agent/summary | what an agent has ready, and one summary as bytes |
GET /api/agent/context | app pool crashes, deploys, certificates and worker processes – with a day, or the list of days |
POST /api/pair | trade a one-time key for a key of your own, so the cluster key is never typed on a web server |
POST /api/ingestPOST /api/agent/heartbeatPOST /api/agent/context | the other direction: an agent that sends by itself delivers its summaries, its heartbeat and its context |
Reports, PCI and the machine itself
GET /api/reportsGET /api/reports/file | the schedules with their next run and the files they made, and one of those files |
GET /api/reviewsGET /api/review | the last thirty daily reviews with the retention figures, and one day in full |
POST /api/review | sign a day off, or move one finding to investigated, accepted or resolved |
GET /api/integrity | every sealed log file with its SHA-256 and whether it is still the same file |
GET /api/audit | who asked this server for what, from which address and with which key |
GET /api/settings | version, role, port, TLS, retention and where the files live – never a key |
GET /metrics | the same numbers in the format Prometheus scrapes |
POST /mcp | the MCP tools over HTTP, for an AI assistant that has nothing installed locally |
One call, from anywhere
curl -H "X-GLog-Token: $key" "https://logserver:7788/api/search?site=Shop&query=status:5xx%20since:1h&limit=20"A question about a site goes to the machines behind it, so the log lines stay on the web server until you ask for exactly those. Each line comes back with the machine it came from.
Changelog
1.1.4 – 21 September 2026
Name a site yourself
An agent reading a folder named the site after that folder, so two web servers running the same site under
different IIS ids – W3SVC1 on one, W3SVC3 on the other – ended up as two separate sites, each with one
machine, instead of one cluster with one report. --agent-path now takes a name in front of the path:
glog --agent --agent-path "Shop=\\web01\d$\inetpub\logs\logfiles\W3SVC1" ...
glog --agent --agent-path "Shop=\\web02\d$\inetpub\logs\logfiles\W3SVC3" ...
Both agents then report site Shop, and the server puts them in one report with the servers side by side. The
name also works on an ssh:// source, and the same string works in the AgentPaths value in the registry. The
equals sign only counts when it comes before the path, so a folder whose name contains one is still just a path.
1.1.3 – 21 September 2026
Two agents and a server on one machine now start
Every certificate G-Log makes for itself is stored under one key name, and making a new one overwrites the key of
the old. Start two agents and a server at the same time on a machine that has no certificate yet, and all three
make one: the last to finish keeps the key, the other two are left holding a certificate whose key no longer
matches. Those two went on listening, and every connection to them failed – no message on either side beyond
SEC_E_INTERNAL_ERROR, "the Local Security Authority cannot be contacted", which says nothing about the cause.
That is exactly what a cluster of two web servers read from one jump server looks like.
Three things changed:
- Only one process at a time creates a certificate, and whoever waited looks again first.
- A certificate is only used when its key really belongs to it, checked by comparing the public key on the certificate with the one on the key itself. So a machine that already has the broken ones recovers by itself.
- Making a new certificate removes the older G-Log ones, because their key has been overwritten anyway.
1.1.2 – 20 September 2026
The report holds its shape
Found on a real IIS server with long URL paths, and on narrower windows than the layout of 1.1.0 was checked on.
- Below 1040 pixels the page no longer scrolls sideways. The table of contents falls back to a strip that scrolls on its own, but the column holding it was sized to that strip, which made the whole page as wide as the list of chapters.
- The five questions size themselves to the panel they are in, not to the window. Beside the key numbers they had half the width and were squeezed into five columns of about 90 pixels, which broke "requests" into "request s". They now take the full row, and where five do not fit they fall back to three and two.
- A long URL stays inside its card. In What changed? a path such as
/ServiceCenter/PlatformServices_v8_0_0.asmxran past the edge of the card and under the one beside it. - The key numbers use the whole row, with the status ring beside the figures instead of below them.
- What changed? no longer says the same thing twice. "Needs a second period" was followed by "Needs a comparison with a second period"; the second line now says how to get one.
Availability says when long-open requests are pulling it down
A site that uses server-sent events, long polling or timers keeps requests open for minutes on purpose. Those requests count in the 95th percentile of every minute they span, so almost every minute is marked bad and availability drops – while the site is answering normally. On a real IIS server this produced 8.7% availability with 0.04% server errors. Availability per minute now says so when such URLs account for a fifth or more of all measured time, and gives their share, with chapter 3 naming the URLs. The figures themselves are unchanged: the minutes really were slow, and a report should not quietly leave data out.
http:// on an https port says so
An agent and a server listen with TLS. A request to http://host:7811/api/hello used to get the connection
closed, which curl reports as "empty reply from server" – true, but it does not say the scheme was wrong. Such a
request now gets 400 Bad Request with one line: this port speaks HTTPS. Only for a first packet that is plainly
not a TLS record; a client that speaks TLS and dislikes the certificate still gets nothing, which is the point of
a certificate.
Download
Release 1.1.4
21 Sep 2026 · Windows x64 · no .NET · no VC++ runtime · EN NL FR ES PT
SHA-256 .msi d0e6598f0de8abefc8d28e084de77bf737c35794bbb97baefd7613fe678a2b38
SHA-256 .exe 7532711985c2cfc3585992648d81df5349fcf9958b33e7968237bd2146cbe6ff
Words about G-Log
Be civilNo linksOne line, 140 charactersChecked before it appears
No words yet.